Year/date not in order in Graph Charts

Hi all!

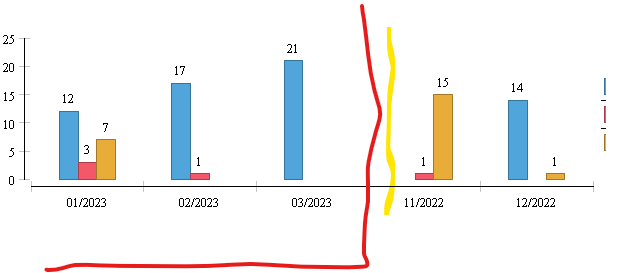
I’m kind of starting to use more of the basic graphs in our reports. I have noticed that it usual happens that the dates do not appear in order when I run a multi-month report, especial in between two years. See Image for clarity. Is there someway I can fix it?
I’d highly appreciate it. again, I’m kind’a new to the chart and Graphs but they do look good on reports.

Thanks,

Johny
Screenshot 2023-03-28 123012

Hi Johny

Let see the help topic on your SMART Desktop

try to find Tips Tricks & FAQ → Ordering Dates & Times in Report Charts

Regard
Lili Sadikin

1 Like

Hi Johny,

Thanks, Lili.

You can access this in the software via 'Help > Help Contents > Search “date & time” > Tips, Tricks & FAQ.

The help contents do not show the final screenshot where the correct settings are made.

The filter should look something like this, where row[“header_0”] is months:

**
image**

Regards,

Alex

1 Like