Hello! We are using SMART to carry out an data analysis between hunting and fauna registry, but I don’t know how to put the points in each category in a different color so that we can analyze them on the query map. Does anyone know how to help me?
Good afternoon
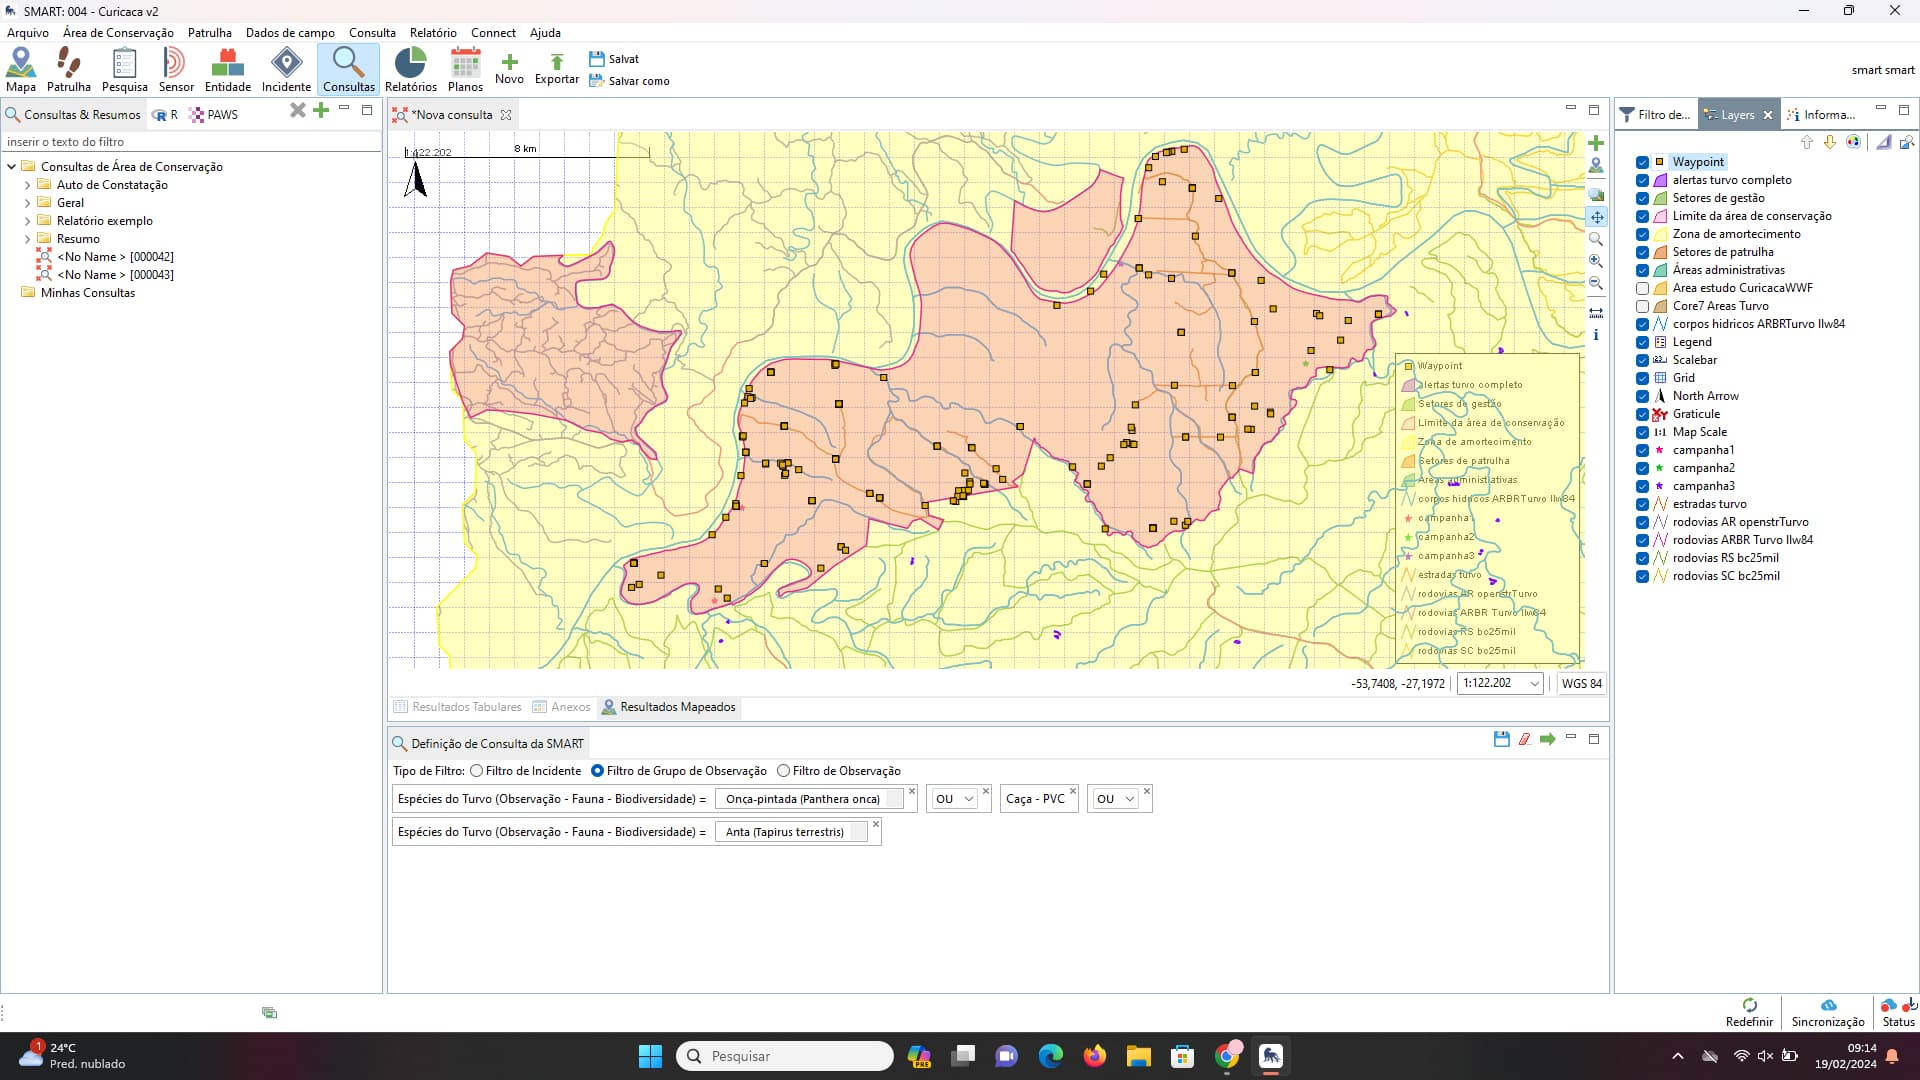
If you have used the categories as its separate query, you can create a Compound Data Query and then specify them there so that each result is its own layer to be viewed in a single pane.
ON the right you can right-click Waypoint and then Style to change the color or shape
Regards