How to visualise a layer with different values?

Hi everyone!

Charina here from WCS Malaysia. Nice to meet everyone.

I have a layer that I’d like to visualise in 4 different colours.

I have a ‘style’ format, with 4 values, that I use in QGIS that looks like this:
Screenshot 2024-05-30 at 11.18.30 AM

Does anybody know how to upload this style, and visualise it in the editor pane in SMART?

Best,
Charina

Hi Charina,

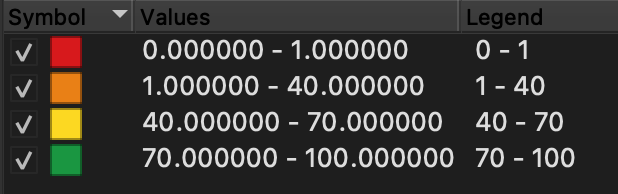
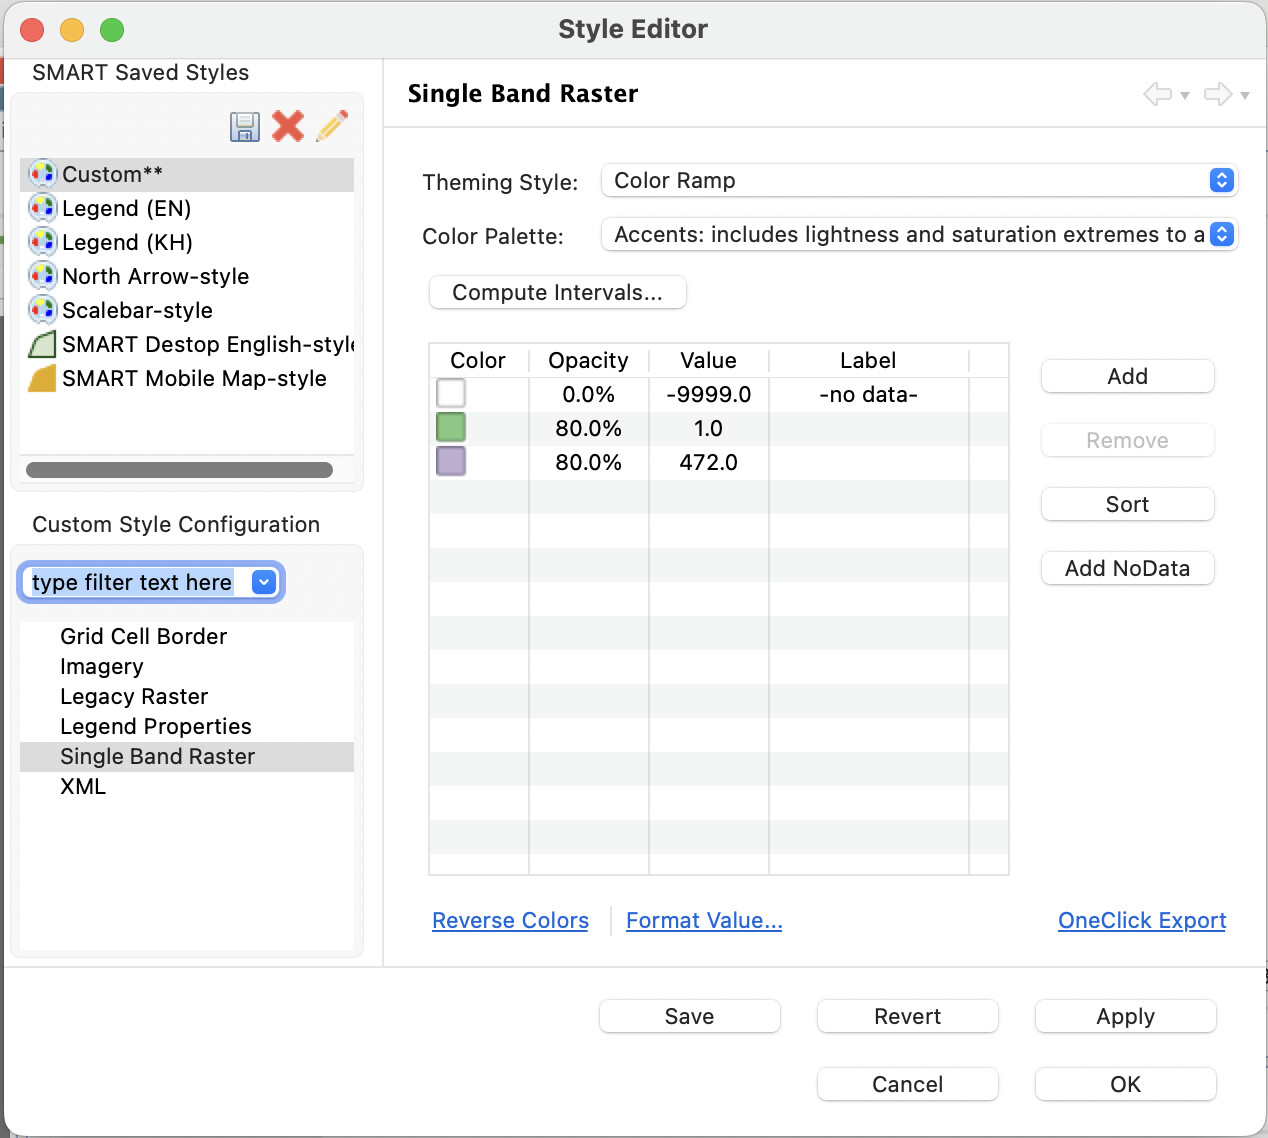
Thanks for your question. In the Style Editor for a layer with multiple values you can compute intervals and assign a colour scheme for each interval. The commonly used application is for a gridded query. Showing a screenshot here.

We will cover this in the advanced training next week!

Cheers
Tony

1 Like

Thanks Tony! This is helpful!

And can’t wait for the training next week! Cheers!