Hi
I was doing a report and used a query. However, the table I get is too long because it includes all the attributes even with blanks. How can edit the query for me to get a table just with the attributes that have values?
Thanks in advance
Jackie
Hi
I was doing a report and used a query. However, the table I get is too long because it includes all the attributes even with blanks. How can edit the query for me to get a table just with the attributes that have values?
Thanks in advance
Jackie
Hi,
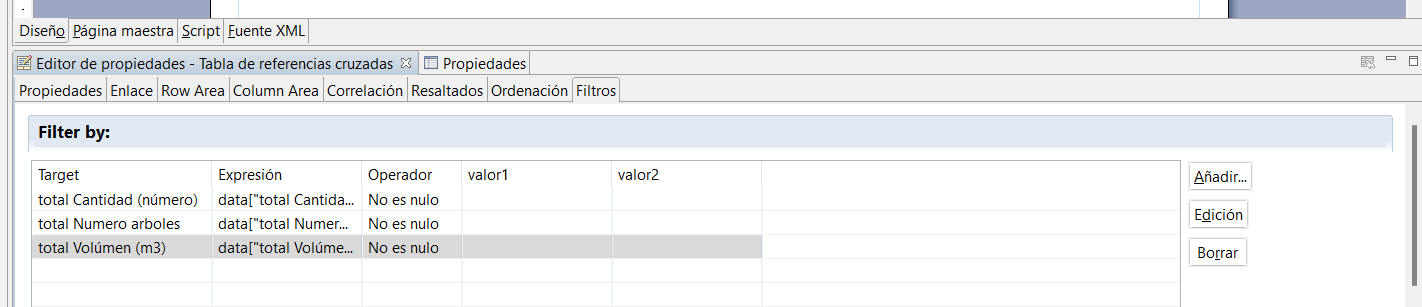
I used the filter option of the Cross Tab Editing properties, but every time I add a filter it understands it as && instead of ll. So I just get the table with the rows that have values for all the attributes and the ones that have some missing values are not considered.
How can I fix this?
Jackie
@Jackie If I’m reading your messages correctly, you’ve done the following:
So-the issue is that you want the table in the report to have fewer A) columns and/or B) rows?
For A) columns, you can do several things:
For B) rows (e.g., I want to see all the wildlife species observed by rangers in a month, but I only want to see the species that were observed listed, not the full species list with many blanks) you can also do several things:
Hi @drew.cronin,
thanks for giving me some ideas. However, when I add the filters SMART still understands as all the filters should be met, instead of any of them.
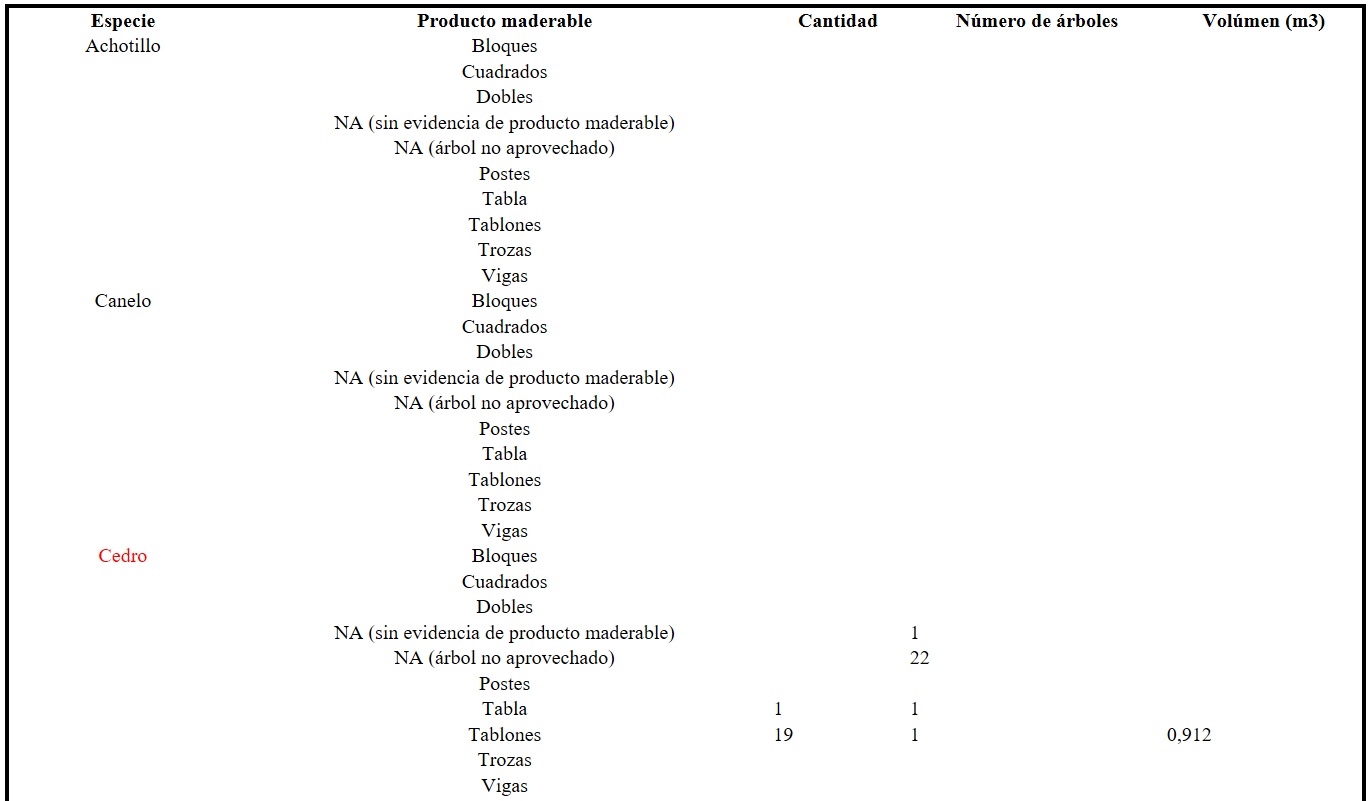
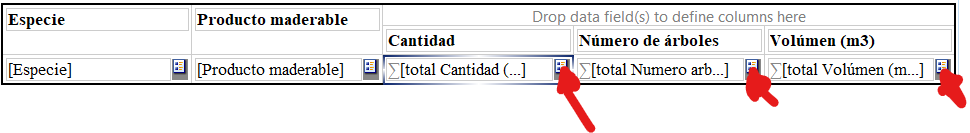
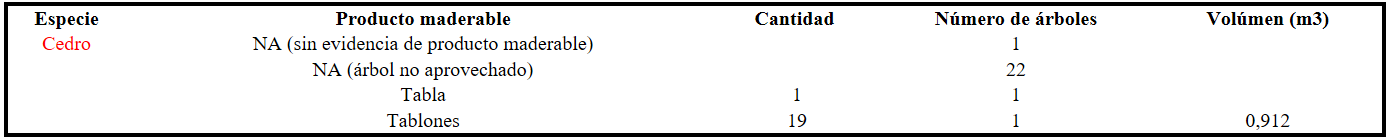
For example, I first got this table
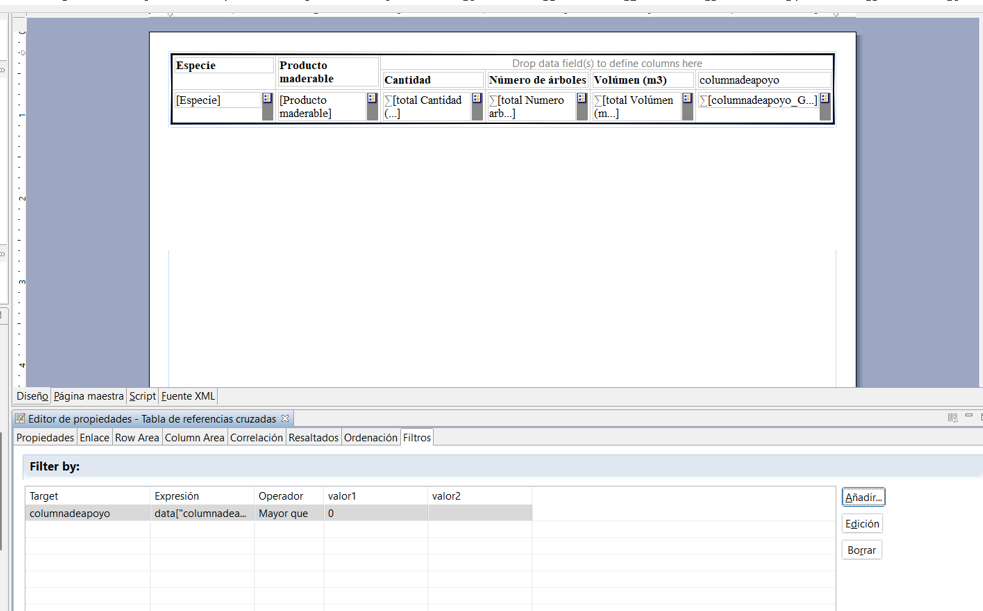
but when I create the filters
I got this other one
What I need is the table to show all the data available for “Cantidad”, “Número de árboles” and “Volumen (m3)” for my specie “Cedro”, even when not all the variables have values.
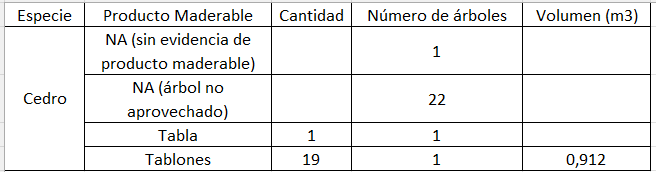
So, I need to erase all the rows that are completely blank for all my variables. Something like this
Thanks in advance for any other idea.
Jackie
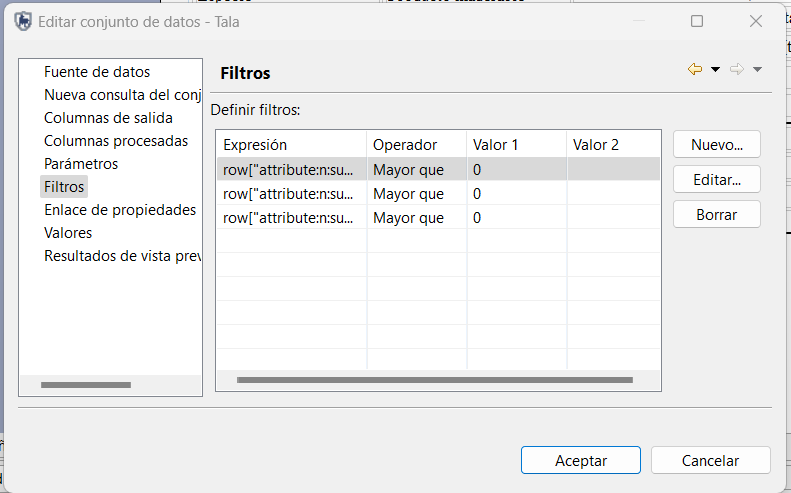
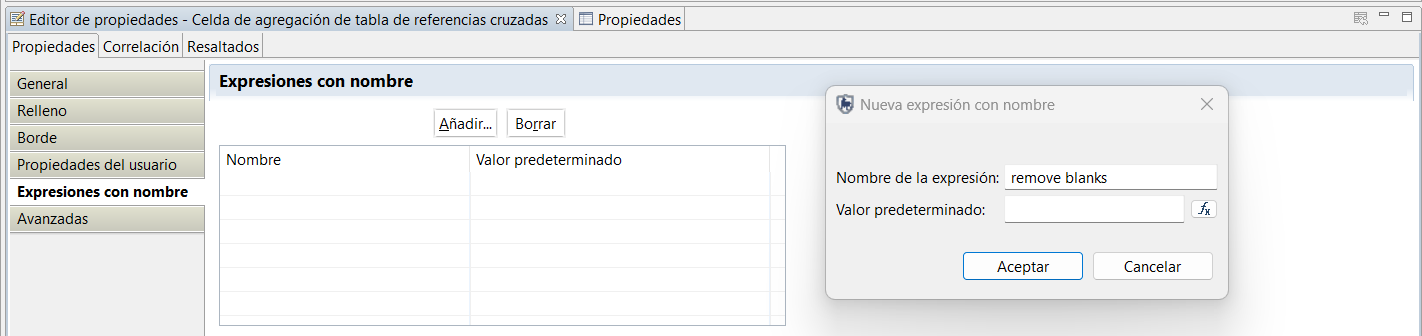
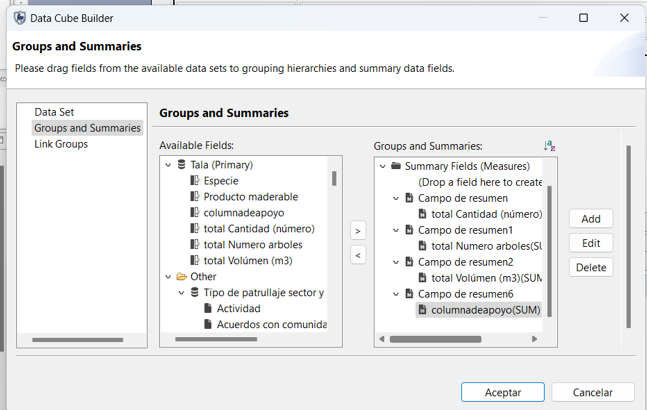
Should I select each variable?
and create an expression for each one?
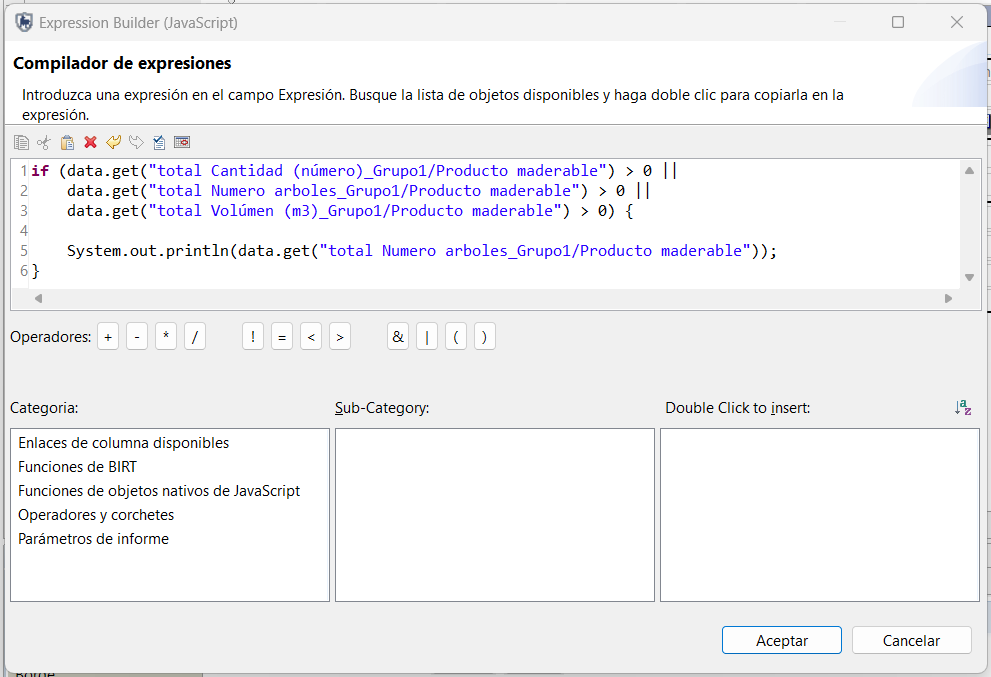
something like this? (still not working because the code may not be correct but I want to know if I have to do it in there)
Jackie
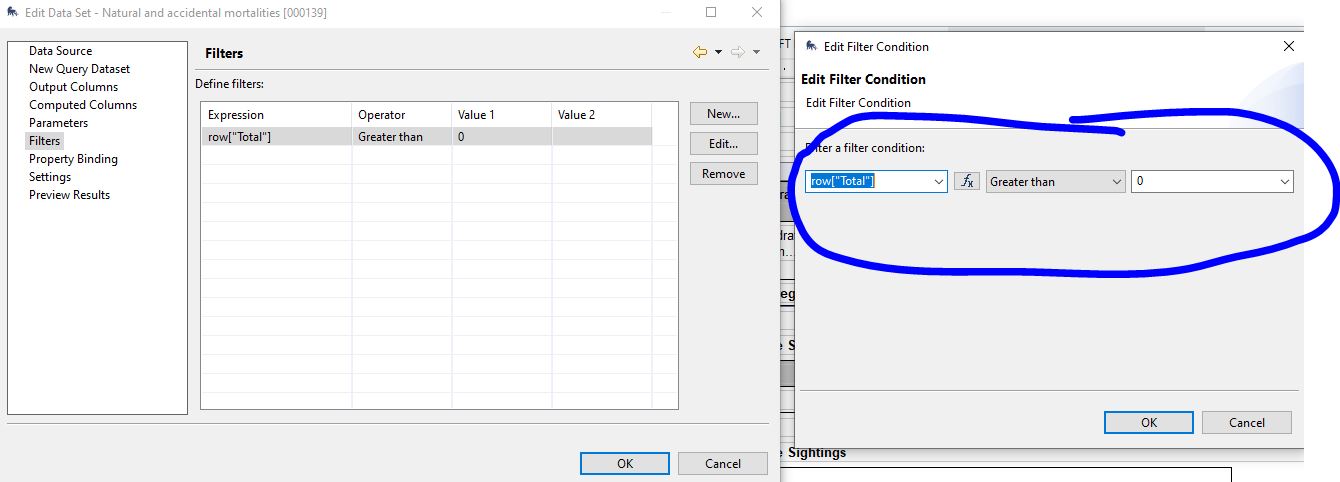
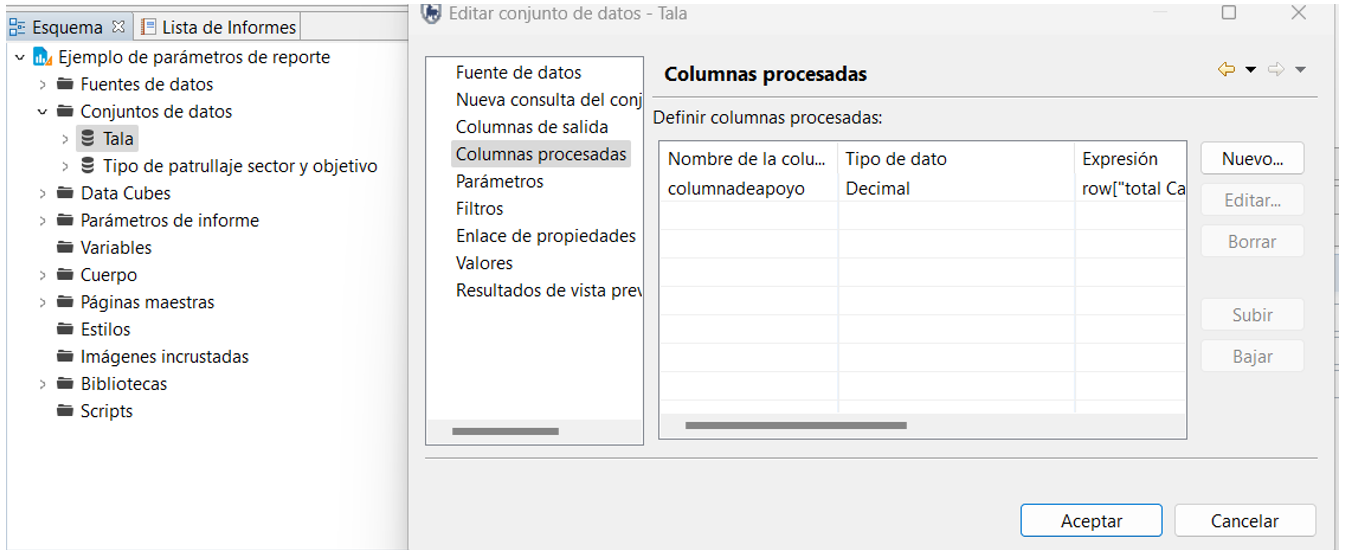
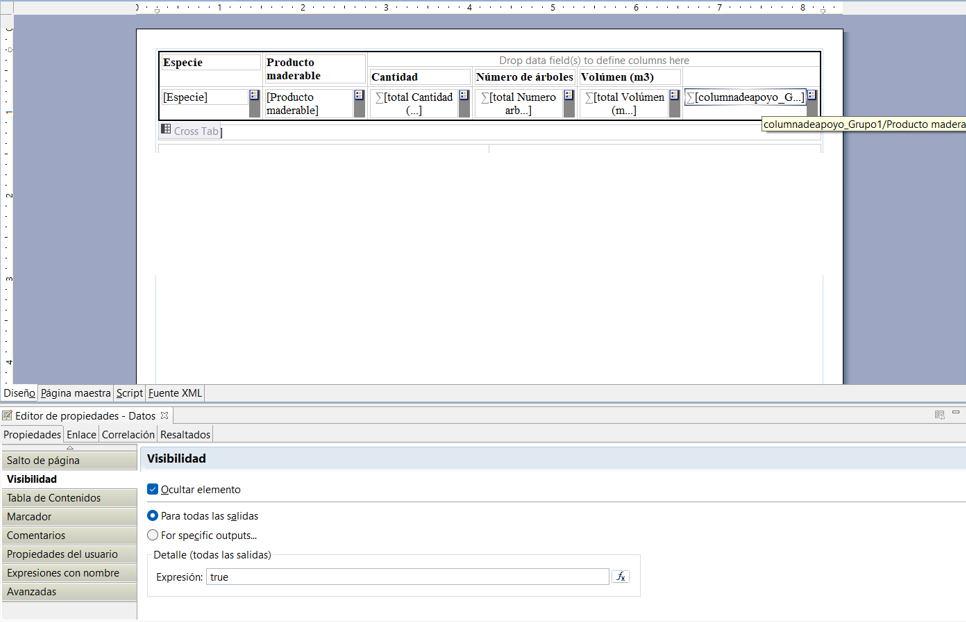
@Jackie Without knowing context specific details, the simplest way I know of to get an output that looks like the table below is to create a computed column and then set the filter for that.
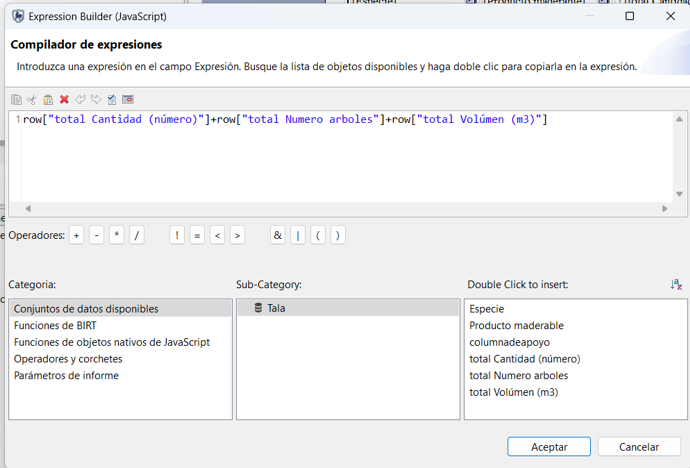
Your computed column in this case could be “Timber evidence” and then you would use the expression builder to define it as:
“Cantidad” + “Numero de arboles” + “Volumen”.
This would just sum the values in those three attributes, but then you would set the filter for the computed column value…
Timber evidence is >0
…meaning if any of those have any value they would make the computed columns value greater than 0 (hence visible).
You wouldn’t need to include the computed column in the table to do this, as you would set this in the data set, not the table itself.
Hey @drew.cronin,
it worked out. Thanks for your support! ![]()
I attach some pictures if it is useful for the forum
Jackie