I want to find out if there is a way to include a running yearly average on patrol graphs in a report. I understand that you specifiy the period when you want the report for (e.g., Dec 1 to Jan 1) but is there way to include data from the last year in this report, or in this specific graph. to display a yearly average as a point of comparison.
Example:
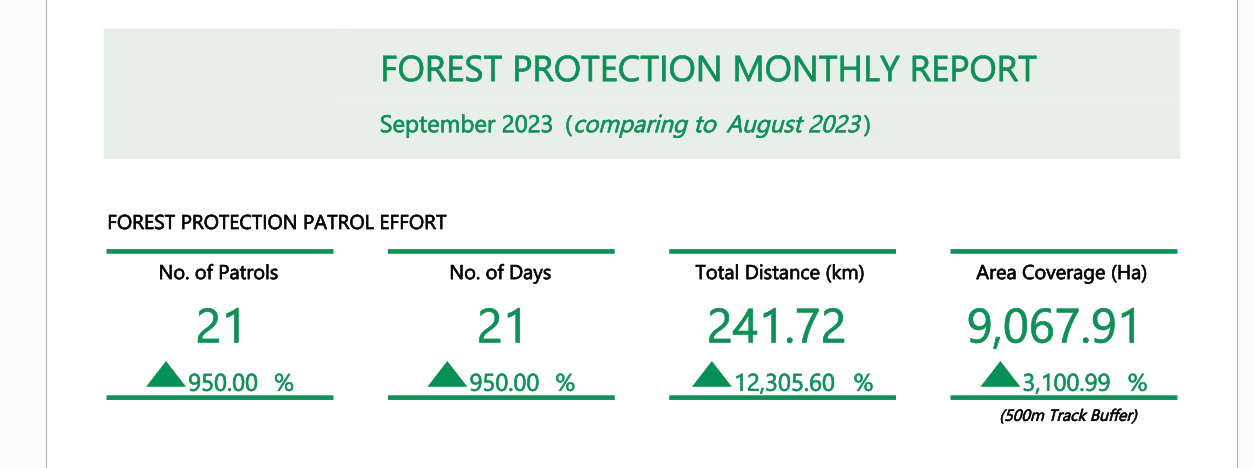
Once I have ran the report I will have the total number of patrols for each reserve, and then somewhere in the graph or text below an average for the total number of patrols for the last year, or previous months.
I am looking to do this specifically for number of patrols, distances travelled, and number of patrol hours.