Regression Trends SMART R-Plugin

Requirements:

  1. SMART 7.4 or above
  2. the R plugin for SMART
  3. R (Download R-4.2.2 for Windows. The R-project for statistical computing.)
  4. R Studios (Download the RStudio IDE - RStudio)
  5. R Tools (RTools: Toolchains for building R and R packages from source on Windows)

An example on how to use the R plugin with pre-written code to analyze illegal activity data in protected areas via the Spatial Monitoring and Reporting Tool (SMART).

In this example, we use a code snippet along with SMART queries of illegal activity observations (traps, illegal hunting camps, and offenders), and divide them by effort (daily km of patrols) to obtain a density estimate for each. Then we plot them with a linear and LOESS regression to examine the general and fluctuating trends in the data.

I have created a GitHub page where I will deposit various code snippets and hopefully get a team of R users to help populate it with more. If you would like to join me, let me know! Also, if you have any specific analyses you would like to automate with the R plugin that doesn’t already exist in SMART, describe it to me and I will see what I can do.

Get the code here: GitHub - RJGrayEcology/smartR: A code snippet repository for reproducible analyses in the Spatial Monitoring and Reporting Tool (SMART) conservation software

Watch a video tutorial here: Regression Trends SMART R-Plugin - YouTube

6 Likes

Thanks for sharing! If any SMART user is interested in using R, we have some updated documentation to share to assist you. Thanks

Yes please do! Has baffled me how to implement. The vid for this analysis helps (esp the last few seconds where Russell actually runs the script inside smart! seeing what it should look like etc) but still would value explainers/worked examples of how to start from scratch with getting an R script to run inside smart. Thanks J

1 Like

Very neat and glad to see example vid of running R inside Smart. I just couldn’t figure out the most basic step how to get the script to read an actual query. The thing it seems I didn’t know about was commandArgs. Is that a base R function?
Tiny q, but should line 23 in the code on github be “myquery3 = args[3]” (this is how it appears in your vid)
Thanks
Jeremy

2 Likes

The only guidance I could find to get going with r-plugin was this:
https://drive.google.com/file/d/185dQ6QndSrxevwxvjV2b7UaEv2ME1SAk/view
and this doesn’t provide any example script or give any clue what commands required in the script to enable it to actually read the queries.
J

Hi Jeremy,

I have just updated the Resource Library with the updated guidance. Here is the link -

Thanks again to @Russell-SVW for all his help reviewing and helping us improve this guidance!

Monica

I only see the image above, the actual document is here i think:

1 Like

I think we could also add (at the end) as a resource the R-Graph Gallery website (https://r-graph-gallery.com/) which is a compilation of all types of graphs and maps that can be made using R with example R code to use and modify.

I think accessing SMART data directly from R and working with the data in R should be a future development. I would be happy to participate in the development of a package to accomplish this task assuming we can get the pieces needed from other packages/projects. smaRt

If someone shows me the structure of the API, I can probably create an R package that wraps the API and allows users to make queries on their Connect data from R. I tried on my own Connect instance and the API seems to be really messy for some reason. I can access the queries, but the outputs come up as a bunch of html noise.

Will look into it more later when I have time.

If you want to play around with it a bit, this is as far as I’ve gotten before things turn ugly:

open libraries

library(httr)
library(rvest)

add your SMART Connect sign in page URL here

url ← “your/smartconnect/url”

run this to log in to your SMART Connect server

session ← session(url)

form ← html_form(session)[[1]]
fl_fm ← html_form_set(form,
j_username = “username”,
j_password = “password”)
main_page ← session_submit(session, fl_fm)

in SMART Connect, when you run a query, copy and paste the link

query_url <-session_jump_to(main_page,
“https://vnconnect.wlpt.org:8443/server/connect/query/api/ec94d3ff-2654-4685-9059-b4ccca6af9b5?format=csv&date_filter=waypointdate”)

1 Like

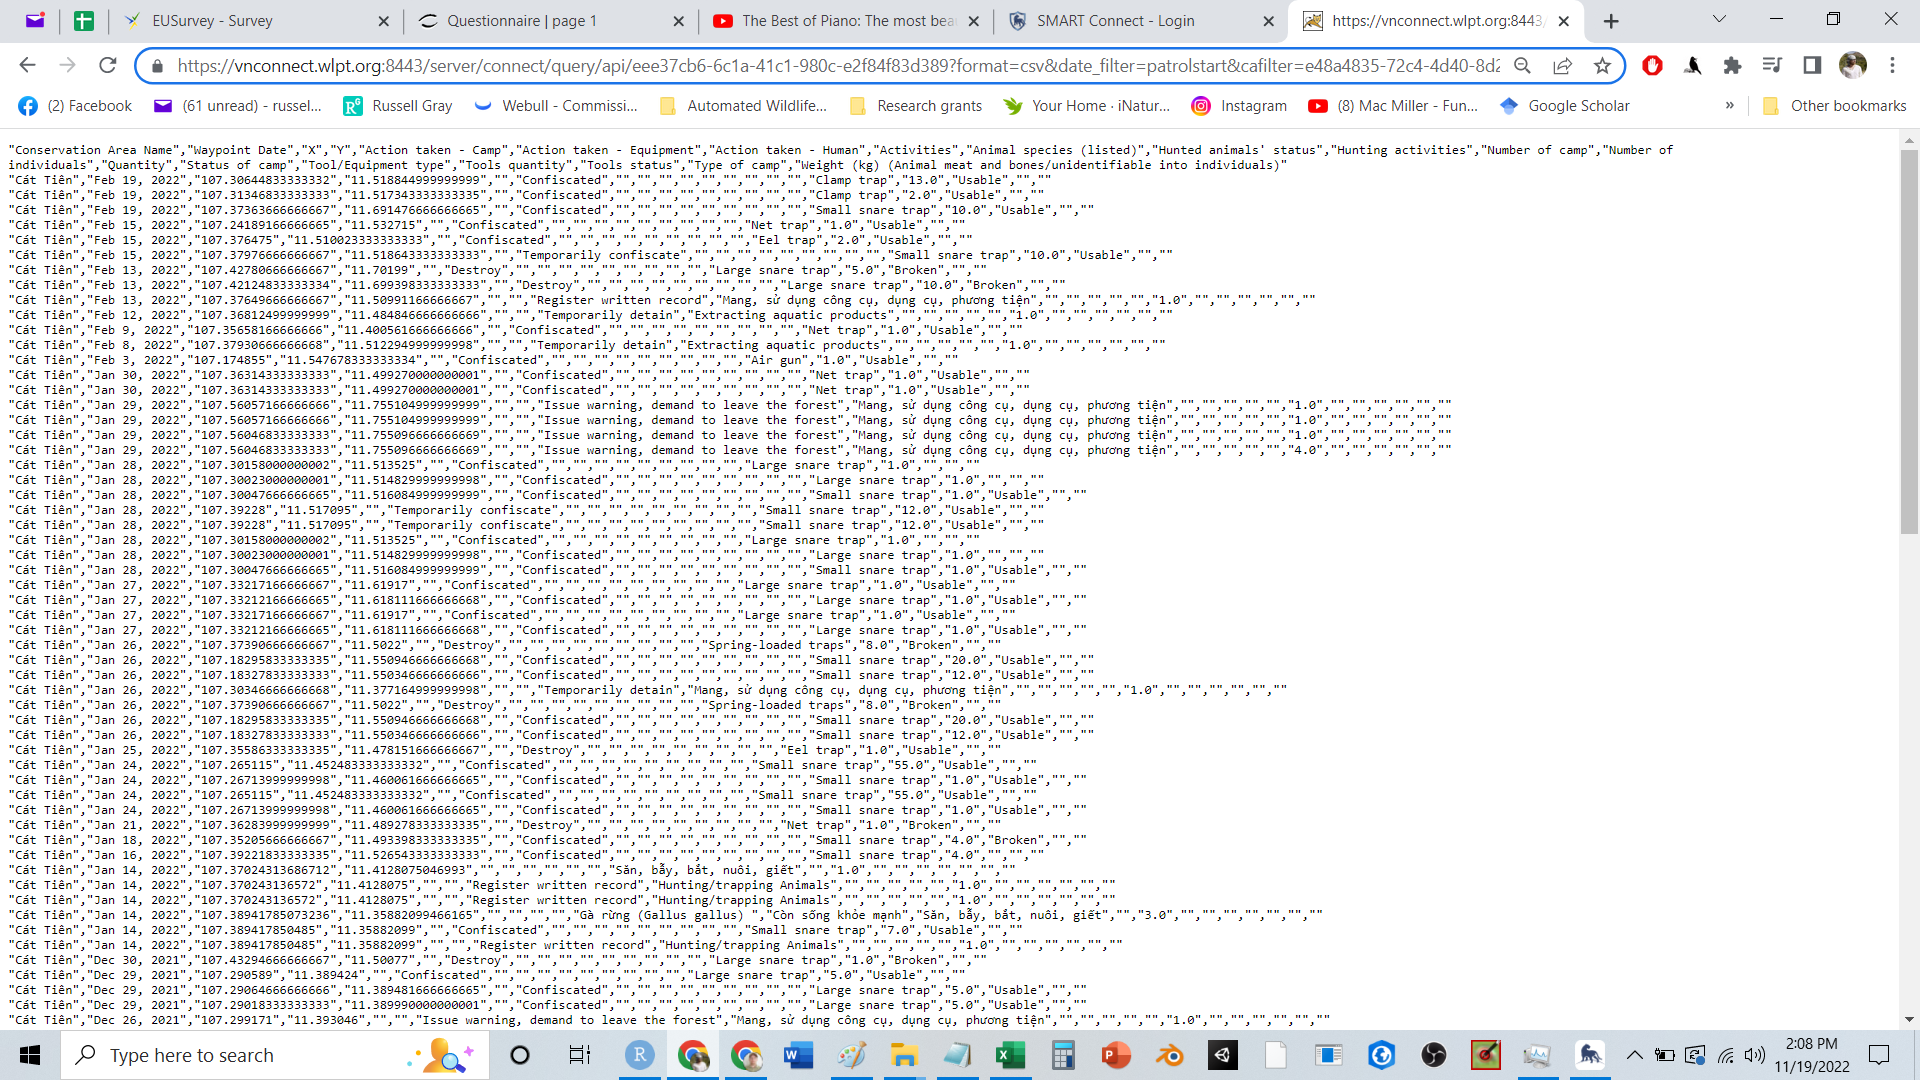
This is great. You are trying to get the output of a query right? I think it would be great to access the data themselves and be able to create summaries from raw.

I added library(jsonlite) and replaced the last chunk

library(httr)
library(rvest)
library(jsonlite)

#add your SMART Connect sign in page URL here
url<- “https://your_connect_url:8443/server”

#run this to log in to your SMART Connect server
session ← session(url)

form ← html_form(session)[[1]]
fl_fm ← html_form_set(form,
j_username = “your username”,
j_password = “your password”)
main_page ← session_submit(session, fl_fm)

#in SMART Connect, when you run a query, copy and paste the link

query_url <-session_jump_to(main_page, “your_link_in_connect_to_a_file”) # ends in /file

data<- httr::content(query_url$response, as = “text”) %>% parse_json()

I did this quickly. the structure of the data output makes sense but I have not checked its content (but I got lat lon values at least)! This is how it looks:

$features
$features[[1]]
$features[[1]]$geometry
$features[[1]]$geometry$coordinates
$features[[1]]$geometry$coordinates[[1]]
[1] 11.5724

$features[[1]]$geometry$coordinates[[2]]
[1] -0.7248667

$features[[1]]$geometry$type
[1] “Point”

$features[[1]]$properties
$features[[1]]$properties$altitude
[1] 0

$features[[1]]$properties$appName
[1] “Monitoreo Karukinka”

$features[[1]]$properties$ctVersion
[1] “1.0.433”

$features[[1]]$properties$dateTime
[1] “2022-11-11T12:01:22.888+01:00”

$features[[1]]$properties$deviceId
[1] “12210a5fe0a745a18f09a60ddd5a5279”

$features[[1]]$properties$id
[1] “ae25a3a3ff934fa38ea70356588d57ed”

$features[[1]]$properties$latitude
[1] -0.7248667

$features[[1]]$properties$longitude
[1] 11.5724

$features[[1]]$properties$rootId
[1] “ae25a3a3ff934fa38ea70356588d57ed”

$features[[1]]$properties$sighting
$features[[1]]$properties$sighting$SMART_3b27559ad9c545838f17fa2cb18b3833
[1] “6334d315768f4d04a4e482c50239d009”

$features[[1]]$properties$sighting$SMART_51c60fc7db4b4a28aa01cca596bbc359
[1] “c84e5ef2da2a40a09587c5ae7376999c”

$features[[1]]$properties$sighting$SMART_DataType
[1] “patrol”

$features[[1]]$properties$sighting$SMART_DefaultAttributeValues
[1] “{}”

$features[[1]]$properties$sighting$SMART_DefaultPatrolValues
[1] “{}”

$features[[1]]$properties$sighting$SMART_Leader
[1] “e:b99744b6eb214da182095afb66f73c06”

$features[[1]]$properties$sighting$SMART_Mandate
[1] “pm:35e1311ae48742a4acfbcde8fe246fd9”

$features[[1]]$properties$sighting$SMART_NewWaypoint
[1] TRUE

$features[[1]]$properties$sighting$SMART_ObsCounter
[1] 1

$features[[1]]$properties$sighting$SMART_ObservationType
[1] “NewPatrol”

$features[[1]]$properties$sighting$SMART_PatrolID
[1] “03e41caf13654f449d587d123fc6323e”

$features[[1]]$properties$sighting$SMART_PatrolStartDate
[1] “2022/11/11”

$features[[1]]$properties$sighting$SMART_PatrolStartTime
[1] “12:01:22”

$features[[1]]$properties$sighting$SMART_PatrolTransport
[1] “tt:58158398a8ff4c7dbc867f9e723c8a4c”

$features[[1]]$properties$sighting$SMART_Team
[1] “pt:2213a07880da4e3ca30b121bbd1b1a8c”

$features[[1]]$properties$sighting$e:b99744b6eb214da182095afb66f73c06
[1] TRUE

$features[[1]]$type
[1] “Feature”

$type
[1] “FeatureCollection”

I know patrols have at least 5 files so how to get the corresponding files into a consistent patrol data … I don’t know yet.
How to get the actual /files links wished by the user? I dunno yet.

Russel

Would you be interested in exploring how we wrap SMART APIs and feed them into a hosted r-shiny instance?

Hey Jonathan, actually that would be quote easy even via the R plugin, I could create a nice flex dashboard with numerous pages of interactive plots. Maybe I’ll throw one together over the weekend and add it to the smartR github project.

I’ll test out Diego’s code fix now and see if I can get one to wrap a connect instance and autoupdate with new information. That would be a nice, free alternative to a hosted dashboard page.

Tried out this solution, but at line:
“# get vector data
data ← content(query_url$response, as = “text”)%>%parse_json()”

I got the error:
"Error: parse error: trailing garbage
“Conservation Area Name”,“Waypoint Date”,“X”,“Y”,“Actio
(right here) ------^”

I tried manually parsing, and trying about 10 other solutions from stackoverflow. If the query output from the SMART Connect API was structured into a table instead of a raw JSON string this would be so much easier to streamline…

Instead its just this mess

Thanks again for contributing this. I got my code to work on the third try.

These resources are really helpful for running queries in SMART using an R script. I am wondering if there is any way to use R scripts to create reports? I’m thinking of writing an RMarkdown document and then would want to read that into SMART somehow as a report so that others can run that script and have the output report directly from SMART without having to use R themselves.
Essentially I’d want to pull the full raw dataset from SMART and create a RMarkdown report and then run the script through SMART and output the final report.
Is this possible?

This is what I was mentioning before. The R plug-in fails when R calls CSS code in Rmarkdown or flexdashboards. So no, we cannot yet make reports using Rmarkdown until the developers find a solution to update the R plugin.

oh okay thanks for the explanation - I wasn’t sure exactly what you meant before. So right now the only capabilities for the R scripts is to run queries and then create plots (which you can display or save to your computer) but not make entire reports. Yes, it would be great if a solution was found for this and would save a lot of time if we were able to write up entire reports in R instead of using the built-in report creating in SMART.

This package allows to load data from SMART connect in R. GitHub - dmontecino/SMARTeR: A set of functions to load query data from SMART Connect to the R environment.

1 Like

Awesome! Thanks for this